The Central Statistics Office (CSO) has published the second of four publications, called Sustainable Mobility and Transport, on the results of the National Travel Survey which was carried out in 2021. The detail in this publication is a subset of the broader data collected. The publication focusses on sustainable mobility such as walking and cycling as modes of travel, and sustainable transport including public transport and electric vehicles, and the facilitators and inhibitors to these modes of transport.
Commenting on the report, Maureen Delamere, Statistician, said, ”this is the first survey on travel behaviour carried out by the CSO since the COVID-19 pandemic reached our shores, the last one having been carried out in the fourth quarter of 2019. When the 2021 survey was carried out, there were still varying levels of COVID-19 in the community, with related restrictions in place.”
Electric Vehicles
The move towards more sustainable transport and moving from place to place in a more sustainable way, continued in 2021. Ownership of electric vehicles (EVs) doubled between 2019 and 2021 with 3% of respondents stating that they own an electric vehicle. By far the most common type of EV in Ireland in 2021 was a hybrid model (45%), while one third of EV owners had a fully electric model and more than one in five (22%) had a plug-in hybrid. According to respondents, the most common deterrent to buying an EV is the purchase price. It was a reason equally voiced by both males (64%) and females (63%). Access to charging points to charge the EVs also remains a disincentive, according to half of respondents who did not own an EV. In addition, more than one in five (21%) had concerns about no or limited access to home charging, while the availability of a public charging infrastructure that is easily accessible and affordable was cited by nearly three in ten (29%) persons who did not own an EV.
Active Travel
Sustainable mobility, through active travel, is also on the increase, with more persons walking and cycling, and doing these activities more frequently. Nearly half (47%) of respondents walked at least five times a week, an increase of eight percentage points on the same period in 2019 (39%). Although smaller numbers are cycling as a form of active travel, with only 14% of respondents cycling at least weekly, one in twenty-five (4%) cycled at least five times a week, up from 2% in 2019.
Nearly half (48%) of walking trips were for the purpose of leisure or exercise – with 49% of males and slightly more (51%) females undertaking this activity. For people who walk less than weekly, personal safety concerns were cited by nearly one in five (18%) females, more than double that of males (8%). Nearly one in five (18%) felt that walking was too inconvenient for shopping, collecting children, etc., while one in seven (14%) said there was unsuitable infrastructure for walking such as footpaths, walking trails, greenways, etc. This same concern regarding lack of suitable infrastructure (suitable cycling routes, cycle paths, etc.) was also cited by almost one in five (19%) respondents who cycle less than weekly.
Public Transport
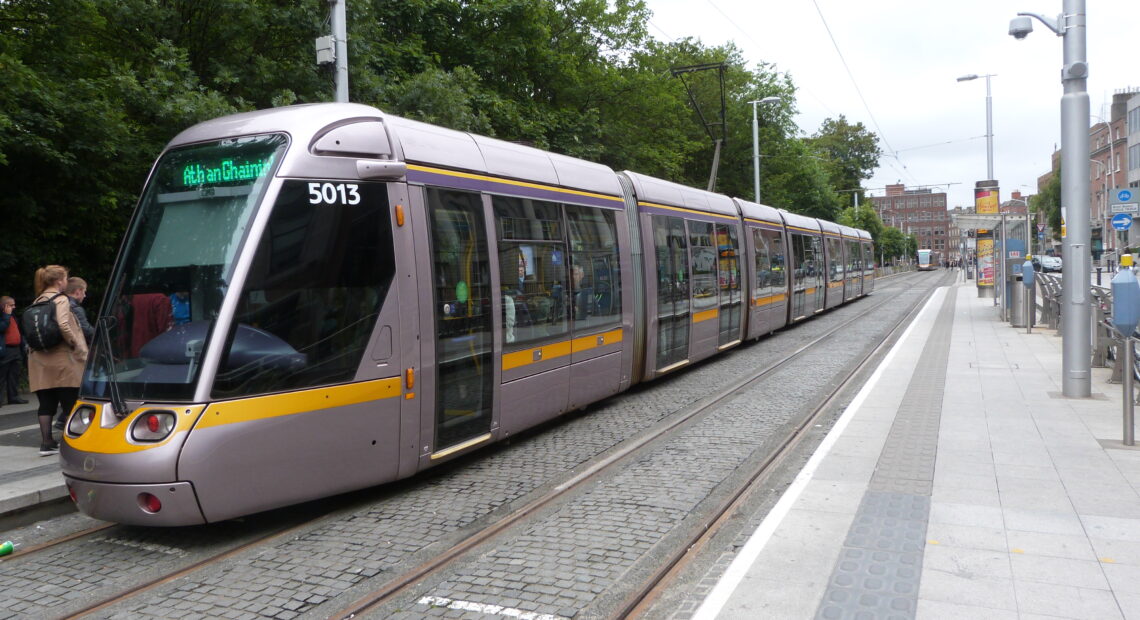
Despite the easing of restrictions elsewhere in the economy and society, restrictions on public transport, such as the requirement to wear face coverings and appropriate seat spacing, remained in place during Q4 2021, when data for this survey was collected. When you consider there were more people working from home during the pandemic, the impact of these restrictions can perhaps be seen in the use of public transport during this period, when it decreased compared to the same period in 2019. Almost six in ten (59%) of respondents never used bus services, while a similar number (60%) never used rail services such as the train, DART, or Luas. By comparison, in the same period in 2019, more than half (51%) of respondents never travelled by rail, and less than half (49%) never used the bus. ‘No service nearby’ and ‘No service to where they wanted to go’ were the main reasons for not using public transport. More than four in ten (42%) respondents who use rail services less than weekly said that there was ‘No service nearby’, compared with nearly three in ten (29%) persons who use bus services less than once a week, while 28% of people who use bus/rail services less than once a week said that there was ’No service to where they wanted to go’.
There is, a high reliance on cars for those who use public transport infrequently. Of persons who used public transport (bus/rail) less than monthly, nearly eight in ten had travelled by car at least three times a week – 64% had travelled by car at least five times a week, while 15% had made a journey by car (as driver/passenger) three to four times a week. Nearly half (47%) of respondents who use public transport less than monthly or never, reside in thinly populated areas, where there may be less availability of and less frequency of public transport. Of these, six in ten say that they use a car as there is no other alternative.”
In relation to alternatives to using the car, Maureen Delamere, further commented, “for more than three-quarters (76%) of drivers undertaking journeys to work by car, there was no alternative mode of travel to go to work. Car-pooling or getting a lift as an alternative travel mode was low for all types of journey and was an alternative option for only 3% of work-related journeys.”
Source: Central Statistics Office